RD* studio

Case 01 — Grupo São Francisco · Health · via WHF

Nine health companies, one front door

A website redo that grew into the full client portal for a leading Brazilian health group — 1.5 million lives, taken from brief to working code in nine months.

Role
UX, UI, research, service design — plus design lead and project manager
Scale
1.5M lives · 9 companies · design team of 5–7, alongside 35+ IT and 15+ marketing
Methods
Design Thinking · Design Sprint · Qualitative research · Scrumban · Object-Oriented UX
Timeline
9 months, from the client arriving to a coded platform
01 — The situation

The brief changed under our feet

Grupo São Francisco was a leading company in Brazil's health sector: a group of nine companies spanning insurance plans, dental coverage, hospitals, and ambulance rental, serving around 1.5 million lives. We were hired to redo the institutional website.

Soon after we started, the job shifted into something much bigger — a complete makeover of the client portal. A logged area, payment, usage history, and self-scheduled medical appointments became the main features. Nine companies — and nine boards' worth of expectations — now pointed at one product.

Meanwhile the design team fluctuated between five and seven people, partially allocated, working in touch with a 35+ IT team on integrations and a 15+ marketing team on content and CRM training.

1.5Mlives served
9companies, 9 boards
5–7designers, partial
50+IT & marketing peers
02 — The turn

Find the intersection, then think in objects

Two decisions shaped everything that followed.

First: frame before designing. I ran workshops across all nine companies of the group, talking with each board to understand where their expectations intersected. That intersection — not any single company's wishlist — became the scope: one portal for nine companies.

Second: Object-Oriented UX as the backbone. Rather than organizing the portal around departments or pages, I brought an object-oriented way of understanding user needs, inputs, and information, and evolved it into the information architecture. Users think in things — a payment, an appointment, a usage record — so the structure was built from those objects and their relationships, then mapped against what the client's ecosystem could already deliver in APIs and coded features.

Nine boards, one scope: the intersection of expectations, structured as the objects users actually think in.

Object-oriented UX model of the portal Four object cards — payment, appointment, usage record, and account — with rows such as core content, metadata, nested objects, and actions, each card showing only the rows it needs. Connectors show payment and appointment nesting inside account, and appointment feeding the usage record. OOUX — objects, not pages PAYMENT core content metadata actions APPOINTMENT core content metadata nested objects actions USAGE RECORD core content metadata ACCOUNT core content metadata nested objects actions feeds nests in one structure of nested objects, mapped to existing APIs
Schematic of the OOUX pass: portal features (payment, appointments, usage history, logged account) modeled as objects with nested relationships, cross-referenced with the APIs the ecosystem already exposed.
03 — The work

From nine boardrooms to a coded platform

  1. Research I could stand behind

    I built the research plan, then did the unglamorous part myself: selecting users, managing the study, and applying most of the interviews. The output was a set of user personas grounded in real clients of the group, not proxies.

  2. Map what already exists before drawing anything

    Per persona, we mapped what the client's ecosystem could already deliver in APIs and coded features, clustered use cases, and validated user journeys. In parallel we benchmarked every key market player, cross-referencing similarities and differentiators.

  3. One site map for nine companies

    The object model became a site map connecting companies, personas, tasks, and needs. From there: mobile-first detailed sketches, then low-fidelity screens sorting out every bit of information to display — covering every company in the group — plus a CMS for the institutional content.

  4. Test with real users, wherever they are

    Designs were validated through prototyping and testing with real users. On one occasion that meant running user tests in a café, recruiting people passing on the street.

  5. A design system with zero placeholder content

    In high fidelity I created the design system: a stylesheet for components, design patterns for how deep and detailed information gets displayed, and recursive information models to minimize cognitive load — plus a great deal of illustrated assets. Not a single piece of information in the design-system file is duplicated; it is all real content.
Site map connecting companies, personas, tasks and needs Diagram in four layers: four labeled company blocks — insurance plans, dental coverage, hospitals, ambulance rental — plus five unlabeled dashed blocks marked as five more in the group connect to persona nodes, which connect to task nodes such as pay a bill, book an appointment, see usage history and manage the plan, all converging into a single portal node on the right. 9 companies personas tasks · needs one portal insurance plans dental coverage hospitals ambulance rental +5 more in the group persona 01 persona 02 persona 0n pay a bill book an appointment see usage history manage the plan LOGGED PORTAL every company in the group, covered in one structure
Schematic of the site map that connected the group's nine companies, the research personas, and their tasks and needs into a single logged portal.
Recursive information model at three depths The same object shown three times, left to right: a compact list row, a summary card with a few fields, and a full record with many fields. Arrows link the three, labeled: same pattern, deeper detail. recursive information model — same object, three depths list row summary card full record same pattern, deeper detail
Schematic of the design-system pattern for information depth: one recursive model rendered as list row, summary card, and full record — built to minimize cognitive load.
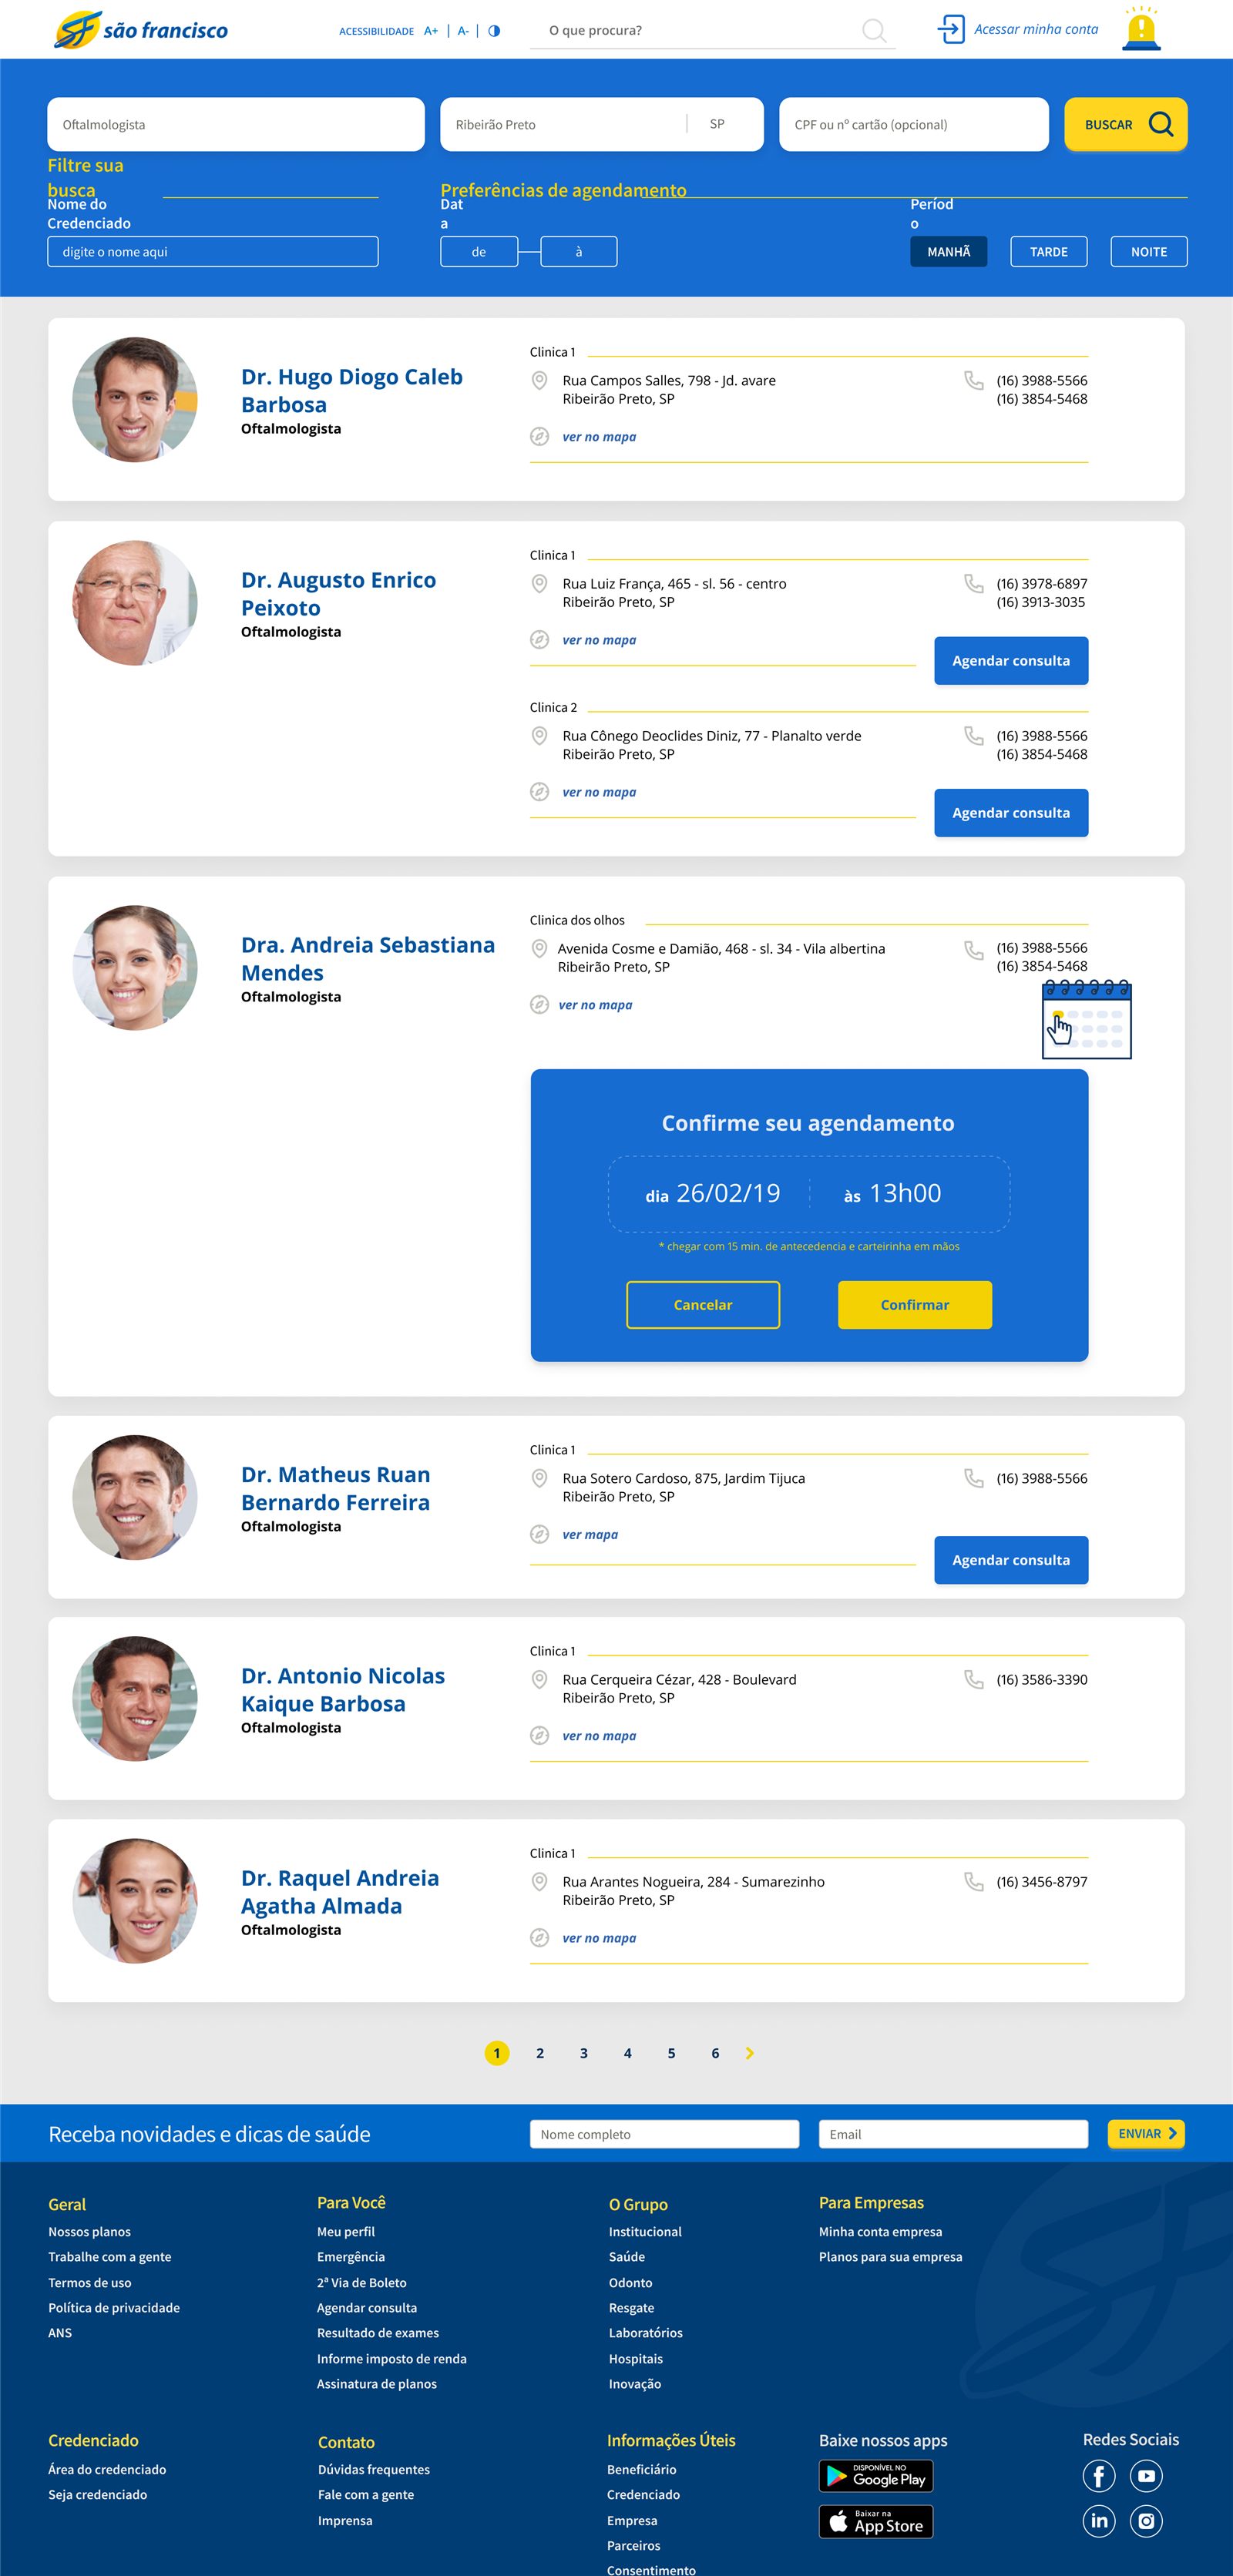
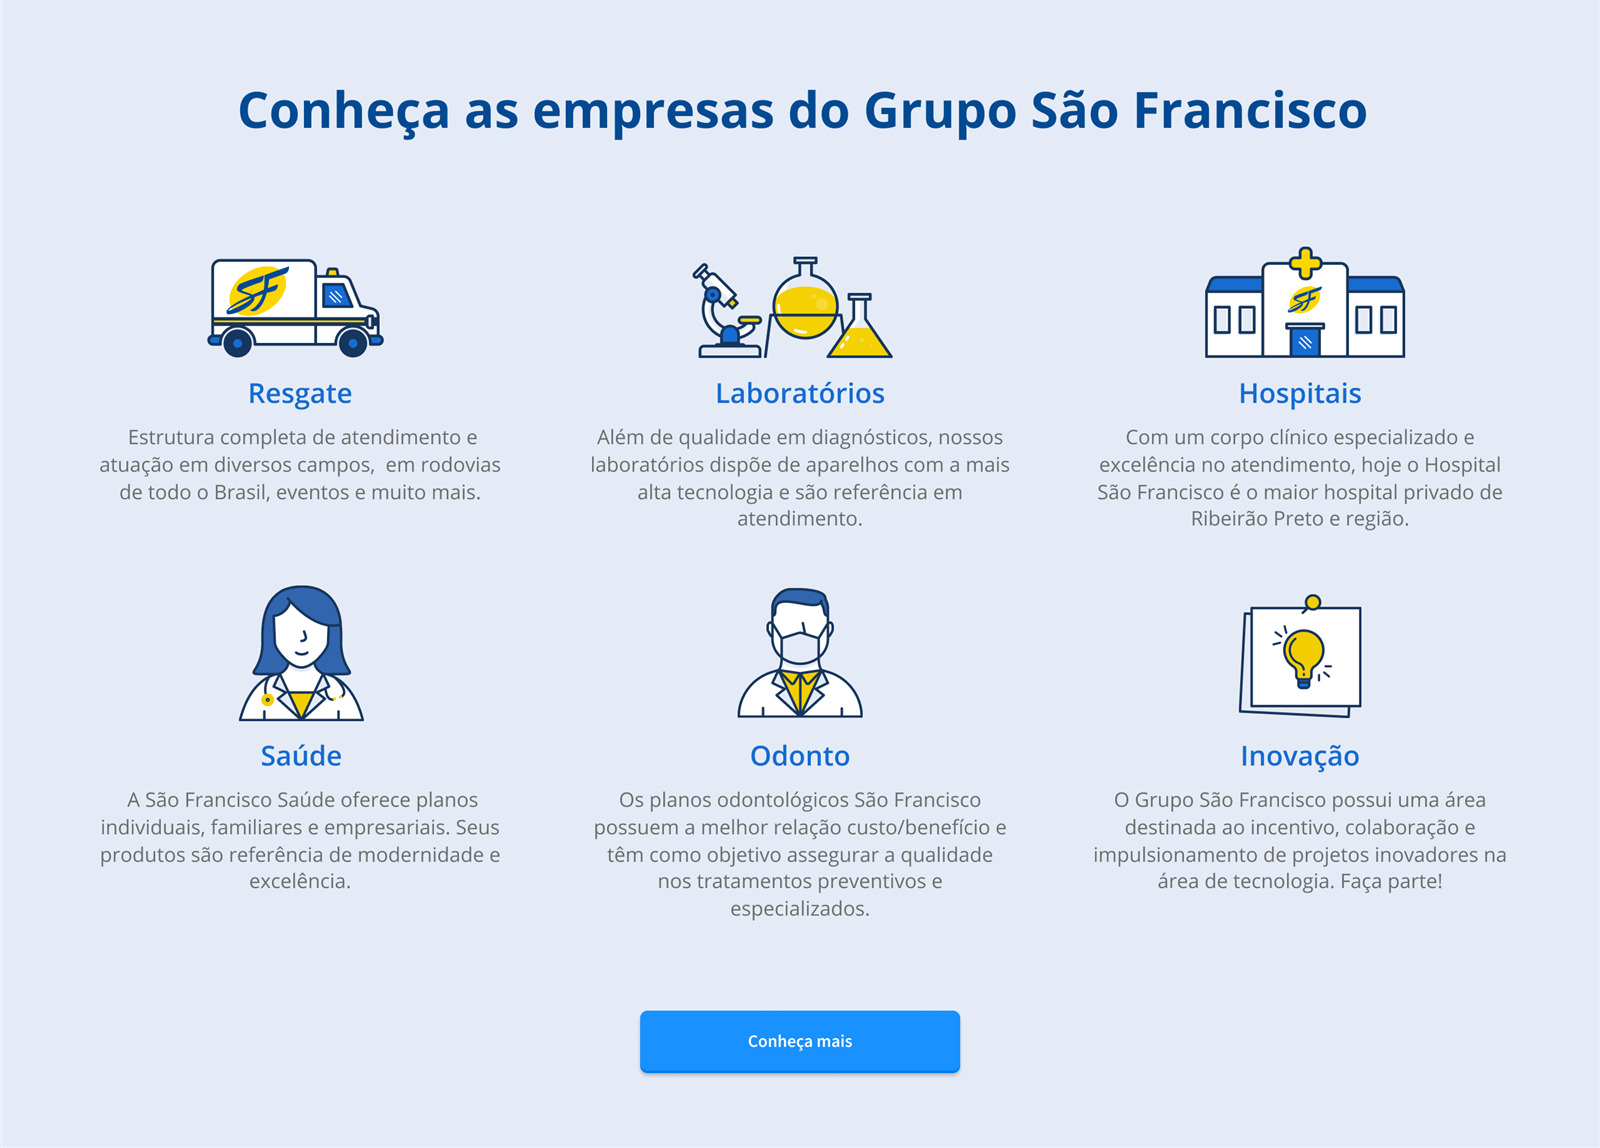
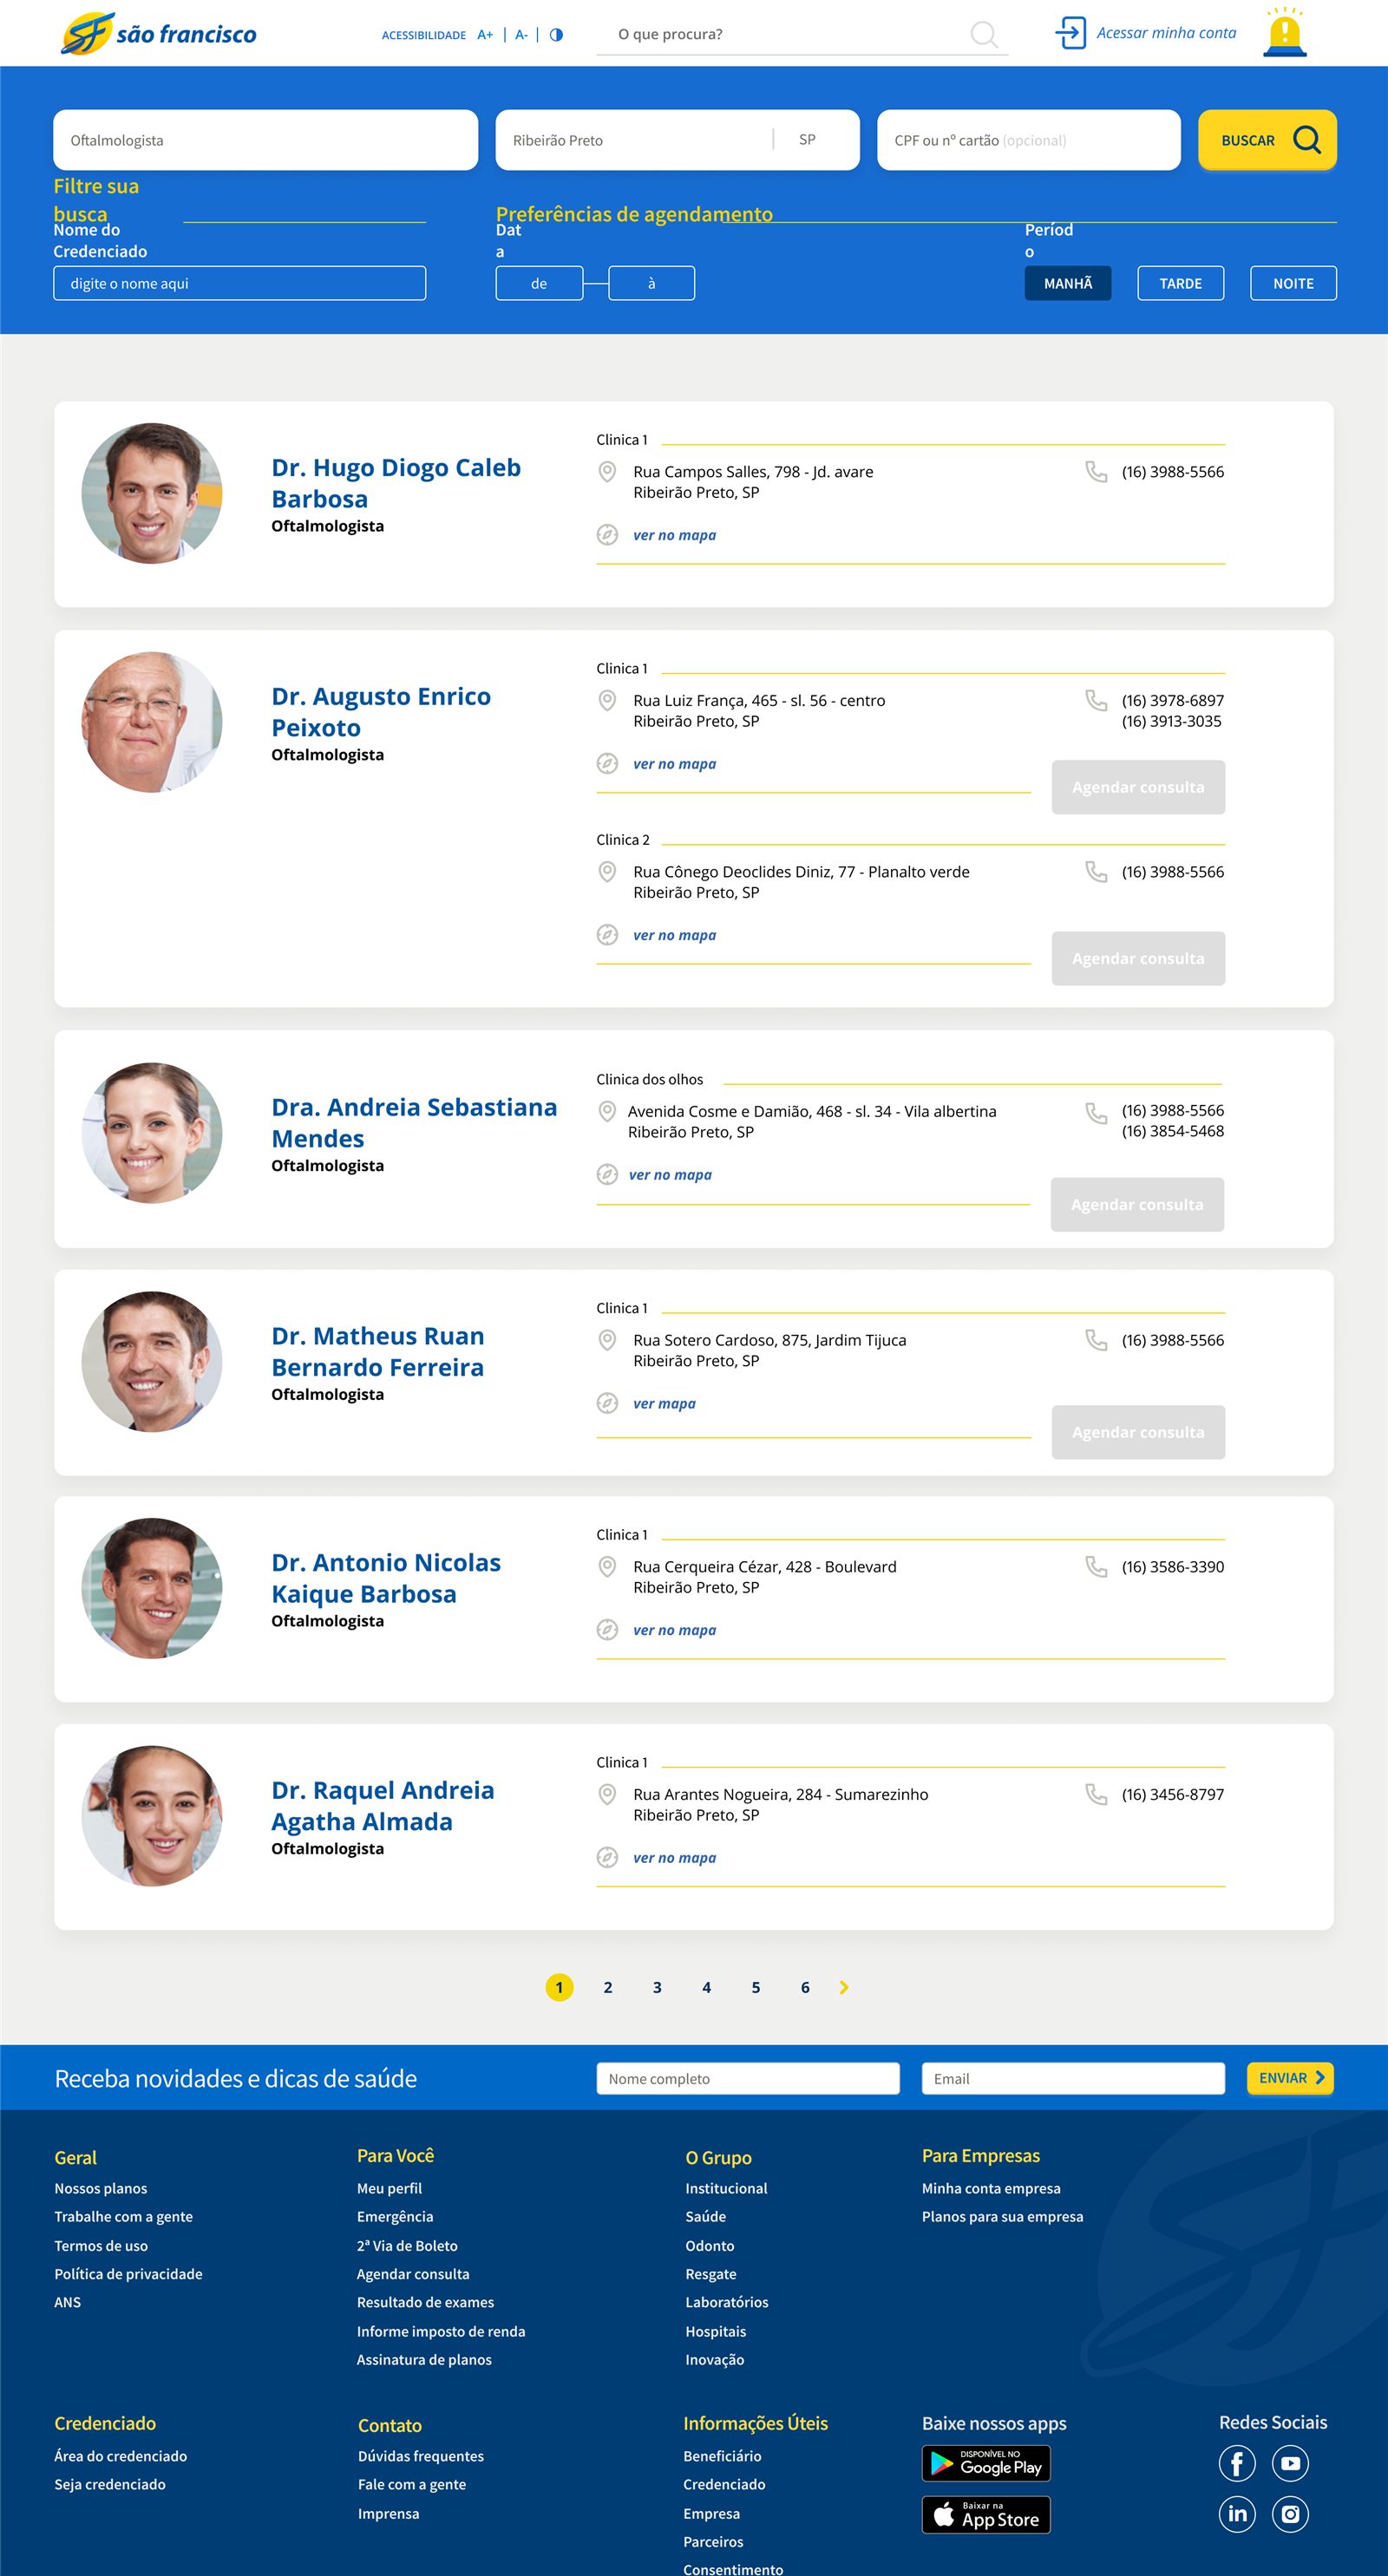
Institutional page from the GSF prototype presenting the group's companies — rescue, laboratories, hospitals, health plans, dental and innovation — with illustrated icons. Doctor search results screen from the logged portal prototype, with professional cards and filters. Self-scheduling flow screen from the portal prototype, for booking a medical appointment online.
Straight from the delivered Figma files: the group presentation with its illustrated assets, the doctor search, and the self-scheduling flow.
04 — Where it landed

Nine months, from brief to a coded platform

In 2019 the group was acquired for around $1.2 billion — which is also why few public traces of the platform remain. Along the way I managed the project, attended client report meetings, facilitated the workshops, led the design team, and interviewed users, with weekly stakeholder reports built on data the team collected and synthesized. The Figma files below are what I can still show.

What this says about how I work

  • I build systems, not one-offs — an object model, a site map, and a design-system file where not one piece of content is placeholder or duplicated; it is all real.
  • I lead and make at the same time: managing the project and facilitating boardroom workshops while still interviewing users and drawing screens.
  • Research means real people — recruiting and interviewing users myself, down to testing prototypes with strangers in a café.